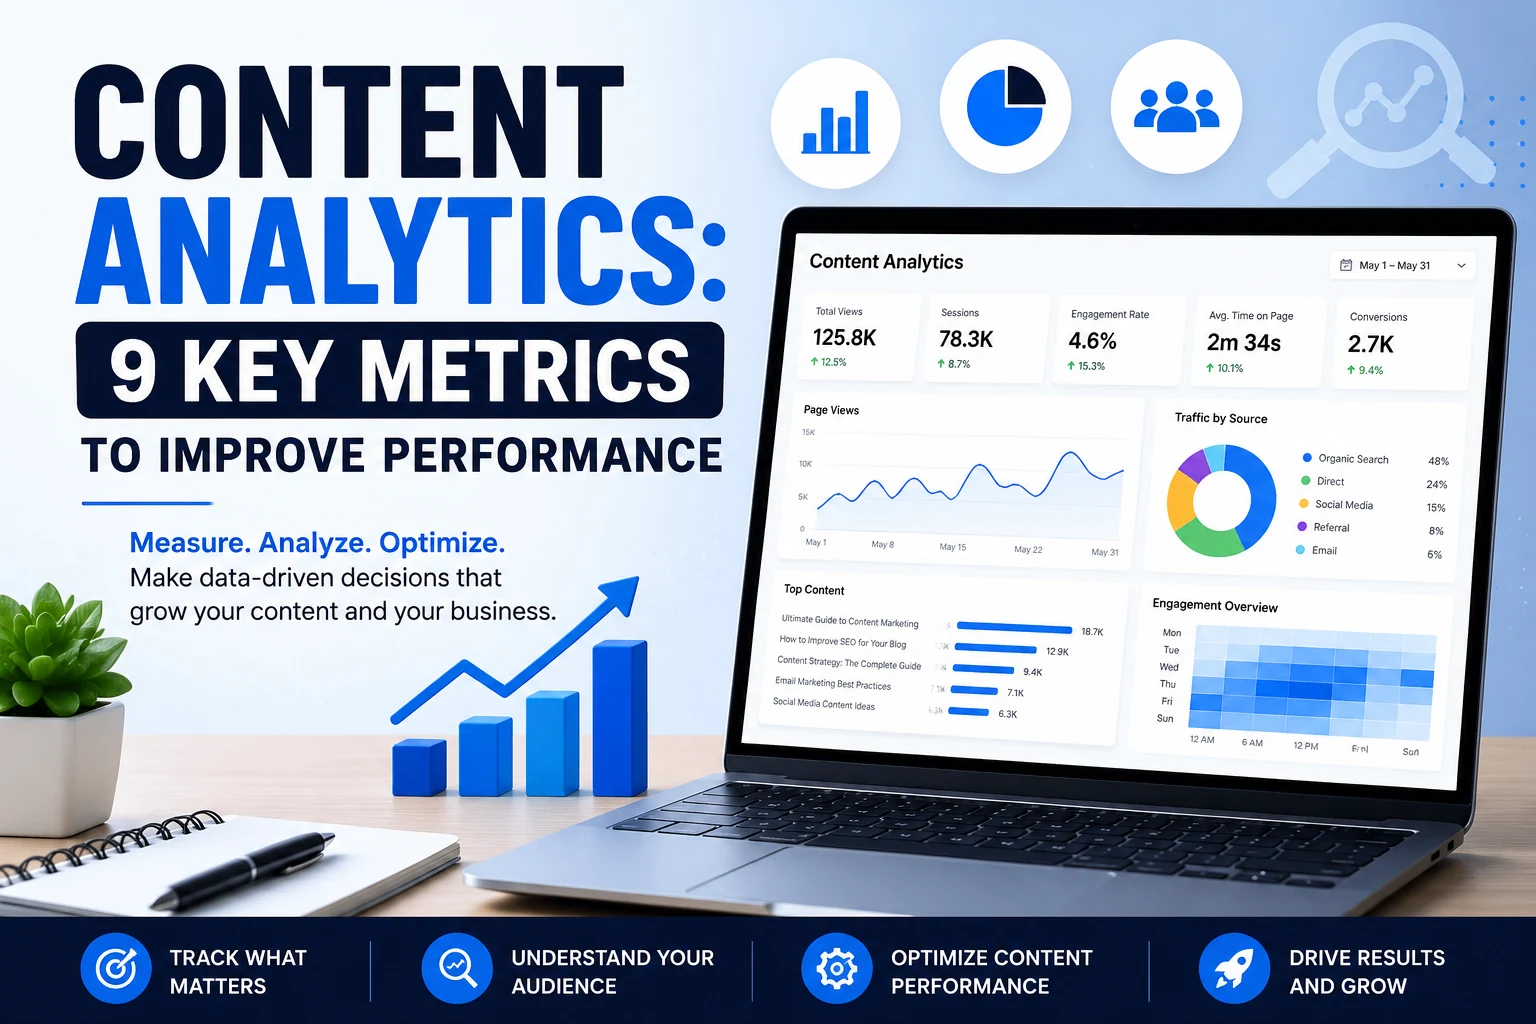
Instead of publishing content and guessing what works, content analytics gives teams a structured way to measure performance, identify trends, understand audience behavior, and make better decisions about what to create, update, promote, or remove.
What Is Content Analytics?
Content analytics focuses on how individual content assets perform across traffic, engagement, search visibility, conversions, and audience behavior. It goes beyond basic website traffic by looking at the specific contribution of content to marketing and business goals.
For example, a page may receive thousands of visits but generate few leads. Another article may attract less traffic but produce stronger engagement, more email signups, or better conversion rates. Content analytics helps reveal that difference.
Marketers often combine website analytics, search data, CRM information, social media metrics, and campaign reporting to build a clearer picture of performance.
Why Content Analytics Matters
Content teams produce blog posts, landing pages, videos, social content, email campaigns, guides, case studies, and other assets. Without measurement, it becomes difficult to know which content deserves more investment.
Content analytics can help businesses:
- identify high-performing content;
- discover underperforming pages that need improvement;
- understand which topics attract the right audience;
- measure organic search performance;
- track engagement and user behavior;
- connect content with conversions and leads;
- find opportunities for updating or repurposing content;
- allocate marketing resources more effectively.
Businesses using broader digital campaigns can combine these insights with Internet Advertising Platforms to understand how paid and organic content work together across the customer journey.
9 Essential Content Analytics Metrics
There is no single metric that proves whether content is successful. The most useful approach is to track several indicators together and compare them against the purpose of the content.
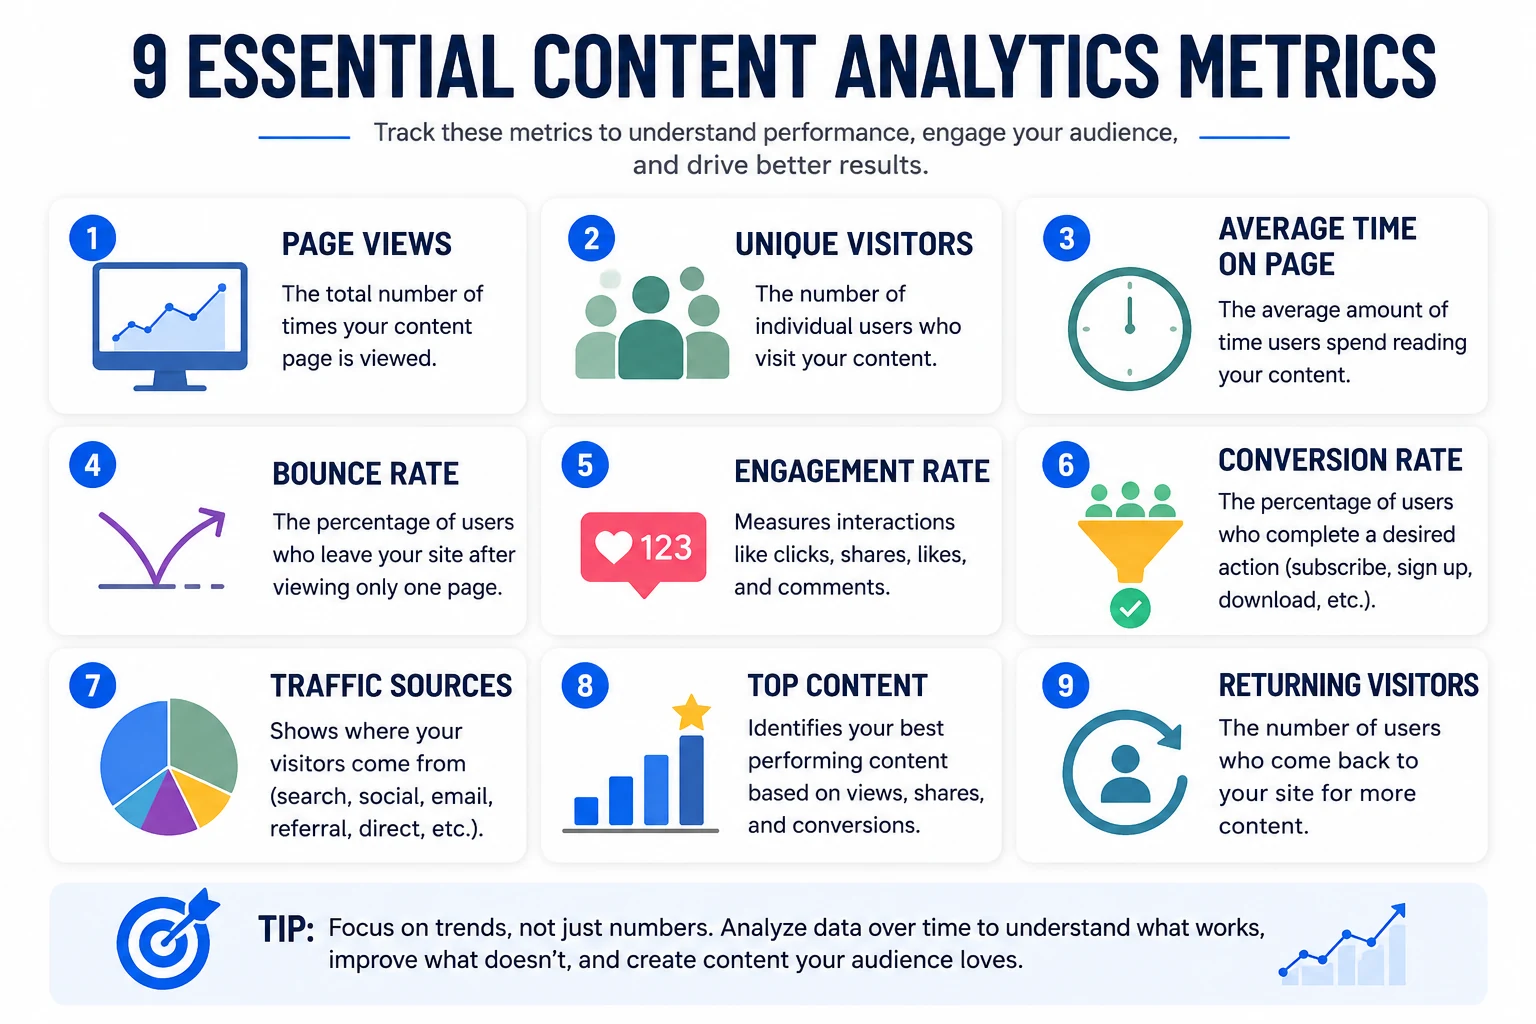
1. Page Views
Page views show how many times a page has been viewed. They are useful for understanding overall content reach, but they should not be treated as a complete measure of success.
A high number of page views may indicate strong visibility, but marketers should also examine what visitors do after reaching the page.
2. Unique Visitors or Users
Unique users help distinguish between total page activity and the number of individual people visiting the content.
This metric is useful when comparing audience reach between pages, campaigns, or time periods.
3. Average Engagement Time
Engagement time helps show whether visitors are actively spending time with a page rather than quickly leaving it.
In Google Analytics 4, engagement metrics are based on engaged sessions and active user behavior. A page with longer meaningful engagement may indicate that visitors are finding the content useful, although the ideal time varies by content type.
4. Bounce Rate
Bounce rate can help identify sessions that did not meet engagement criteria. In GA4, bounce rate is the inverse of engagement rate.
A high bounce rate is not automatically bad. A visitor may read a short answer, get exactly what they need, and leave. Always interpret bounce rate in context.
5. Engagement Rate
Engagement rate measures the percentage of sessions that qualify as engaged sessions. It is useful for understanding whether visitors interact meaningfully with a website or app.
According to Google Analytics documentation, an engaged session is one that lasts longer than 10 seconds, has a key event, or includes at least two page or screen views.
6. Conversion Rate
Conversion rate measures the percentage of visitors who complete a desired action. Depending on the business, that action could be:
- submitting a lead form;
- buying a product;
- starting a trial;
- booking a call;
- downloading a resource;
- joining an email list.
This metric is especially important because strong content should ultimately support a useful business or audience outcome.
7. Traffic Sources
Traffic-source analysis shows where visitors came from. Common channels include:
- organic search;
- direct traffic;
- social media;
- email;
- referral websites;
- paid advertising.
Understanding traffic sources helps marketers compare the quality and behavior of audiences from different channels.
8. Top-Performing Content
Identifying your best content helps reveal which topics, formats, search queries, headlines, and distribution channels consistently perform well.
Top content should be evaluated using more than raw traffic. A page may be valuable because it generates conversions, earns backlinks, ranks for important keywords, or supports another stage of the customer journey.
9. Returning Visitors
Returning visitors can indicate whether content is building repeat engagement and audience loyalty.
For publishers, SaaS companies, educational websites, and content-led businesses, repeat visits can be an important sign that readers see ongoing value in the site.
Content Analytics vs Web Analytics
Content analytics and web analytics overlap, but they are not exactly the same.
| Area | Content Analytics | Web Analytics |
|---|---|---|
| Main focus | Performance of individual content assets | Overall website and user activity |
| Common questions | Which content performs best? | How is the website performing? |
| Typical metrics | Engagement, conversions, search visibility, content performance | Users, sessions, events, channels, conversions |
| Main purpose | Improve content strategy | Understand digital behavior and website performance |
In practice, marketers often use web analytics tools as an important source of content analytics data.
Content Analytics Process: Measure, Analyze, Optimize, Grow
A useful content analytics workflow can be divided into four stages.
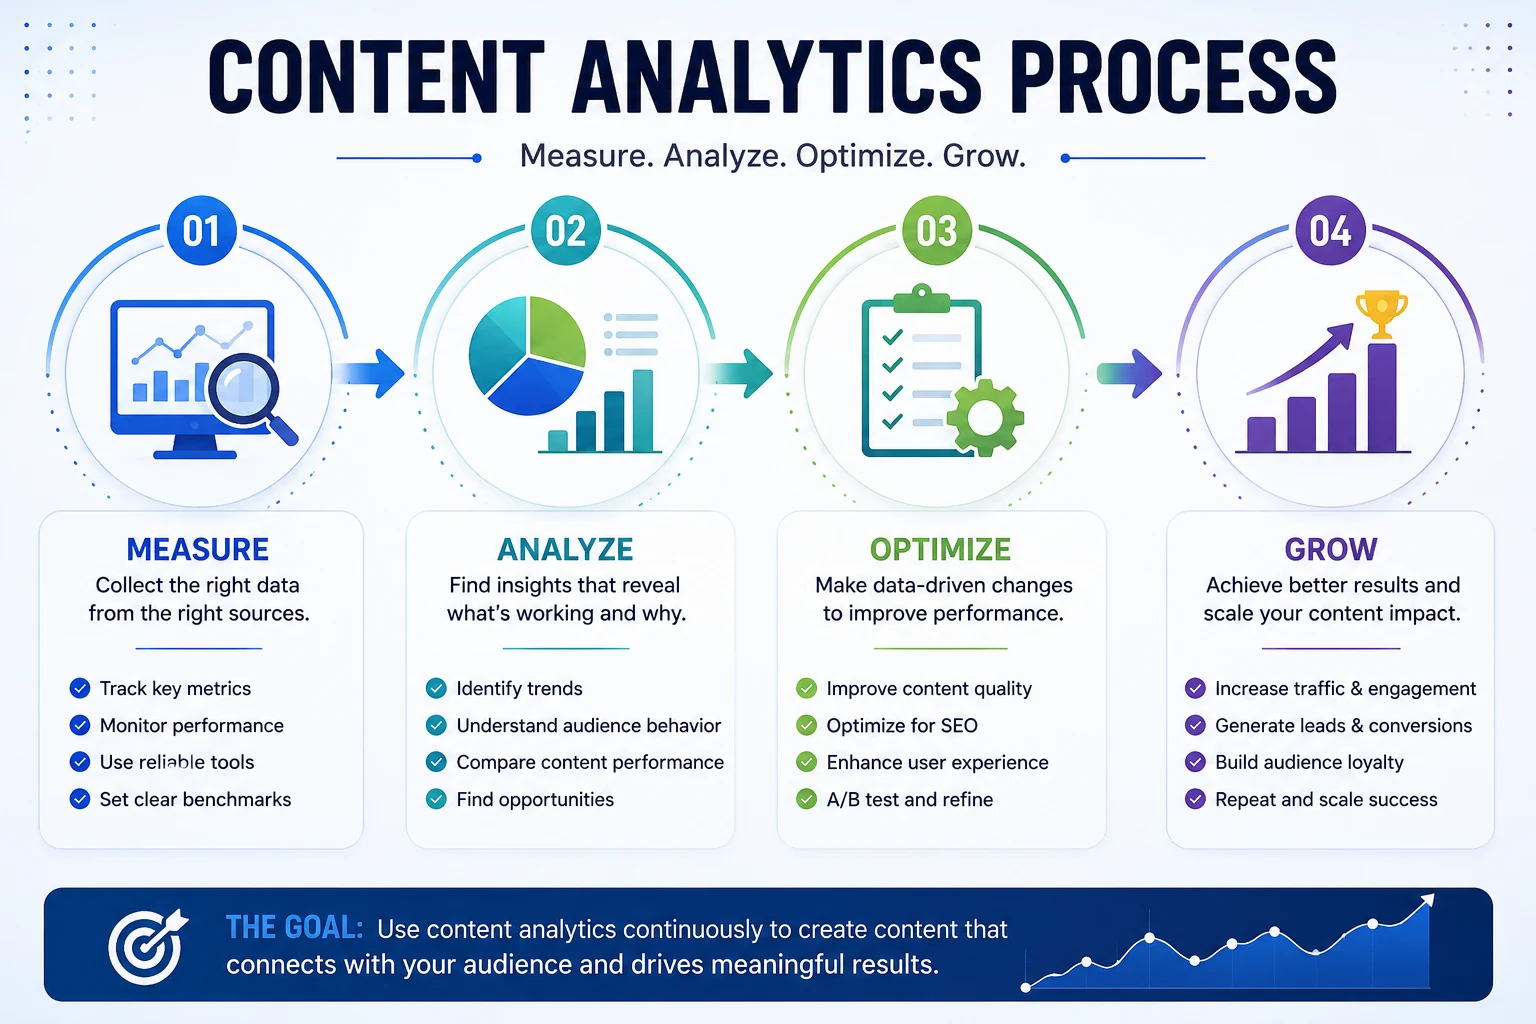
Step 1: Measure
Start by collecting the right data. Choose metrics that match the goal of the content.
For example, an educational article may be judged on organic impressions, engagement, backlinks, and newsletter signups, while a product landing page may be measured primarily by leads or sales.
Step 2: Analyze
Look for patterns rather than isolated numbers. Compare:
- one page against similar pages;
- current performance against previous periods;
- different traffic sources;
- new visitors against returning visitors;
- high-converting content against low-converting content.
The goal is to understand why certain content performs better.
Step 3: Optimize
Use the findings to improve the content. Possible actions include:
- updating outdated information;
- strengthening weak headings;
- improving internal links;
- adding clearer calls to action;
- improving page speed or mobile usability;
- expanding sections that match search intent;
- refreshing images and examples;
- consolidating overlapping pages.
Teams working on search performance can also review the XVIFS guide to Best AI SEO Tools for additional tools that can support content optimization and SEO workflows.
Step 4: Grow
Once strong patterns emerge, use them to guide future content creation. Successful topics can become clusters, high-performing formats can be repeated, and weak areas can be corrected before additional resources are invested.
How to Use Google Search Console for Content Analytics
Google Search Console is one of the most useful free tools for understanding how content performs in Google Search.
The Performance report can show:
- clicks;
- impressions;
- click-through rate;
- average position;
- queries;
- pages;
- countries;
- devices.
Google explains that the Performance report can be used to see which queries bring traffic, how search traffic changes over time, and which pages have stronger or weaker click-through rates.
For content teams, this data can reveal pages that already receive impressions but rank too low, pages with high rankings but weak CTR, and queries that suggest new sections or related topics.
How to Use Google Analytics 4 for Content Analytics
Google Analytics 4 helps marketers understand what happens after users arrive on a website.
Useful content-related metrics include:
- users;
- sessions;
- engaged sessions;
- engagement rate;
- average engagement time;
- events;
- key events;
- traffic acquisition;
- landing-page performance.
Search Console explains how people find content through Google Search, while GA4 helps show what visitors do after arriving. Using both provides a more complete picture.
Content Analytics Tools
Different tools answer different questions. A complete content analytics stack may include several platforms rather than one product.
Google Analytics 4
Useful for user behavior, engagement, acquisition, and conversion measurement.
Google Search Console
Useful for organic search queries, impressions, clicks, CTR, ranking positions, and page-level search visibility.
SEO Platforms
Platforms such as Semrush and Ahrefs can provide keyword, competitor, backlink, and ranking data that complements first-party analytics.
CRM and Marketing Platforms
Tools such as HubSpot can help connect content interactions with contacts, campaigns, leads, pipeline, and revenue.
HubSpot describes content marketing analytics as the process of measuring how specific content assets influence traffic, engagement, leads, and revenue.
Social Media Analytics
Native social analytics can help teams evaluate reach, engagement, video views, clicks, shares, and other platform-specific signals.
How to Build a Content Analytics Dashboard
A useful dashboard should be simple enough to guide decisions. Avoid filling it with dozens of numbers that nobody uses.
A practical dashboard might contain:
| Goal | Recommended Metrics |
|---|---|
| Organic visibility | Impressions, clicks, CTR, average position |
| Traffic | Users, sessions, page views, traffic sources |
| Engagement | Engagement rate, engagement time, events |
| Lead generation | Form submissions, key events, conversion rate |
| Content quality | Returning visitors, backlinks, engagement, assisted conversions |
| Growth | Trend comparisons over time |
The dashboard should answer business questions rather than simply display available data.
How to Analyze Content Performance
A practical monthly review can follow this sequence:
- Identify the pages with the highest traffic.
- Find pages gaining or losing organic impressions.
- Check which search queries trigger important pages.
- Review engagement and conversion performance.
- Identify content with strong impressions but weak CTR.
- Find content ranking on pages two and three of search results.
- Review outdated articles that still receive traffic.
- Look for high-performing topics that deserve related content.
- Create an optimization list for the next period.
This turns analytics into an ongoing content-improvement process rather than a reporting exercise.
Common Content Analytics Mistakes
Tracking too many metrics
More data does not automatically create better decisions. Focus on metrics connected to the objective of the content.
Judging everything by traffic
Traffic is valuable, but a page with less traffic may generate more qualified leads, stronger engagement, or better customer outcomes.
Looking at one day in isolation
Daily performance can change because of seasonality, campaigns, news, algorithm changes, or random variation. Trends are generally more informative than isolated snapshots.
Ignoring search intent
A page may rank poorly because it does not actually satisfy what searchers want. Analytics should be combined with SERP and query analysis.
Ignoring conversion tracking
If a business cannot connect content with meaningful actions, it becomes difficult to understand commercial value.
Never acting on the data
Analytics has little value if reports are produced but nothing changes. Every review should lead to clear actions.
How AI Can Support Content Analytics
AI can help marketers summarize large datasets, identify patterns, group search queries, analyze audience feedback, draft reports, and generate optimization ideas.
However, AI should support analysis rather than replace judgment. Data quality, business context, attribution limitations, and changing market conditions still require human interpretation.
Organizations exploring broader practical applications can read our guide to AI Business Solutions.
Frequently Asked Questions About Content Analytics
What is content analytics?
Content analytics is the process of collecting and analyzing data about content performance so marketers can understand traffic, engagement, search visibility, conversions, and audience behavior.
Why is content analytics important?
It helps businesses identify which content performs well, understand what audiences value, improve weak content, and make better decisions about future marketing investment.
What are the most important content analytics metrics?
Important metrics include page views, users, engagement time, engagement rate, bounce rate, conversion rate, traffic sources, top-performing content, and returning visitors.
What tools are used for content analytics?
Common tools include Google Analytics 4, Google Search Console, Semrush, Ahrefs, HubSpot, CRM platforms, and native social-media analytics tools.
What is the difference between content analytics and content analysis?
Content analytics generally focuses on measurable performance data, while content analysis can also refer to evaluating the themes, meaning, structure, or characteristics of the content itself.
How often should content performance be reviewed?
Important metrics can be monitored regularly, but monthly or quarterly reviews are often more useful for strategic decisions because they provide enough data to identify meaningful trends.
Can content analytics improve SEO?
Yes. Search data can reveal ranking opportunities, CTR problems, query variations, declining pages, and content gaps. These insights can guide updates and internal-link improvements.
Final Thoughts
Content analytics turns content marketing from guesswork into a measurable improvement process.
The goal is not to track every available metric. It is to identify the data that explains whether content is reaching the right audience, creating meaningful engagement, and contributing to business objectives.
Start with a small set of relevant metrics, combine Google Search Console with user-behavior data, review trends consistently, and use the findings to improve existing content before simply producing more.
The strongest content teams do not just publish. They measure, analyze, optimize, and grow.